Trading stocks profitably on a daily basis requires extensive experience, knowledge of the markets and timing. When first starting out, it may be daunting and intimidating when seeing others making stock trades that are worth thousands of dollars on a daily basis, executing dozens of trades per day. But you do not need to start that way, you can start small, even with limited funds and work your way up.
Before fully investing yourself in stock trading, they are a few basics you will need to cover such as practice, analyzing stocks, and sticking with a strategy, which can and will change as you get more experienced with trading stocks. One of the best ways to get an understanding and feel of trading stocks, is to practice on a stock simulator with virtual money. This would allow you to follow stock prices in real time, make quick making buying and selling decisions based on your knowledge of the current market and trading all kinds of financial instruments, from stocks to Exchange Traded Funds (ETFs). You need to feel that you have enough knowledge to perform thorough trade analysis and justify your trading decisions.
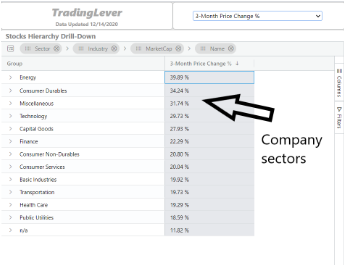
Once you feel as though you have gained valuable experience trading on a virtual stock simulator, it is vital that you get a trading strategy, a road map of what type of industries you will invest in (as shown in the picture to the right), size of the companies (market capitalization) (we could insert a link a page with the most common finance words and their definitions here), and knowing financial metrics.

You might hear the term, bullish or bearish in finance and what it refers to is a bull market/trader or a bear market/trader. A bull market is when the stock market is increasing and it is expected to continue this trend. A bear market is the opposite, a stock market that is experiencing an overall decline. Both types of traders reduce their risk by diversification, which is the process of investing or trading in different stocks in various industries, so that if one industry is impacted in a bear market, your other investments in different sectors are not as impacted.
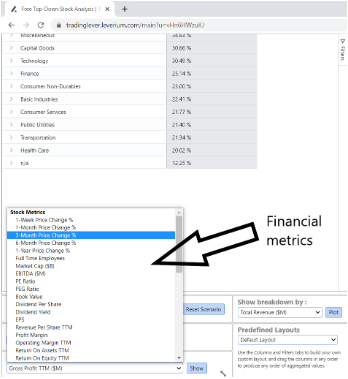
Knowing financial metrics is quite important as they allow you to get a quick peek at a company’s financial health and future prospects (To the right are examples of financial metrics on the trading platform, TradingLever). Examples of financial metrics are the balance sheet, income statement, volume, and candlesticks. For example, candlesticks are some of the most widely used metrics in day trading and show the price of a stock as a chart, showing the high and low points of the stock, while also showing the start and end price for a particular time. As a day trader, it is important to know the price range of a stock at all times. All these are important for proper trade analysis.
There is no best strategy in which you can use, there are many different strategies you can follow and you must choose the best one that suits your needs as a stock investor, from what type of sectors you will like to invest in to your experience level. Every stock trader starts with a certain strategy and with more experience, adjusts it in various ways to better suit their needs. This could be changing industries, increasing your trade amounts or executing more trades on a daily basis. No matter what strategy you use as a stock trader, it is important to understand financial terms, reading charts and stock analysis, all of which are available on the site!