One of the common approaches stock traders and investors use to analyze stock is the top-down analysis approach. In the top-down stock analysis approach, the investors first analyze global macroeconomic trends and factors, then research industries and sectors that can take advantage of the macroeconomic trends, and finally select stocks that they believe can benefit from the favorable macroeconomic factors.
To make the top-down stock analysis process easier for investors, Trading Lever is provided for free, for easy and free stock charting across the whole Nasdaq and NYSE stocks. Leverium has developed an excellent, easy-to-use, and interactive stock analysis platform. The stock analyzer contains a detailed list of stocks and industries with all the metrics, making it convenient for traders to select the appropriate stocks. The platform also offers investors to filter and sort stocks and industries based on the selected criteria. In this article, we will discuss this top-down stock analyzer and how you can apply the top-down approach with the help of this tool to analyze and select stocks for investment. You can access the stock analysis tool by asking us for the link.
Features of the stock analysis tool:
The platform gives investors a range of options to select the right stock based on the selected criteria. It also provides free stock charts based on the stock or stock aggregate selected (to plot by industry to by sector). While selecting stocks, investors analyze different metrics and data about the stocks to make an informed investment decision. With the Trading Lever stock analysis tool, investors can sort stocks based on the following metrics:
- Price change percentage (1 week to 1 year)
- No. of employees
- Market Capitalization
- Earnings
- PE Ratio
- PEG Ratio
- Book Value
- Dividend Per Share
- Book Value
- Dividend Per Share
- Dividend Yield
- Earnings Per Share
- Profit Margin
- Return on Equity
Many other metrics are also available to investors, which can help them in their stock selection strategies.
How to Use the Free Stock Charting and Analysis tool:
Using the Trading Lever stock analysis tool is easy. With the tool’s interactive design, investors can conveniently select the metrics from the list of available options, and the software will compile the results. Let’s try to understand the layout of the software and perform some basic functions to make you familiar with the platform. The following example will give you an idea of how to use the stock analysis tool:
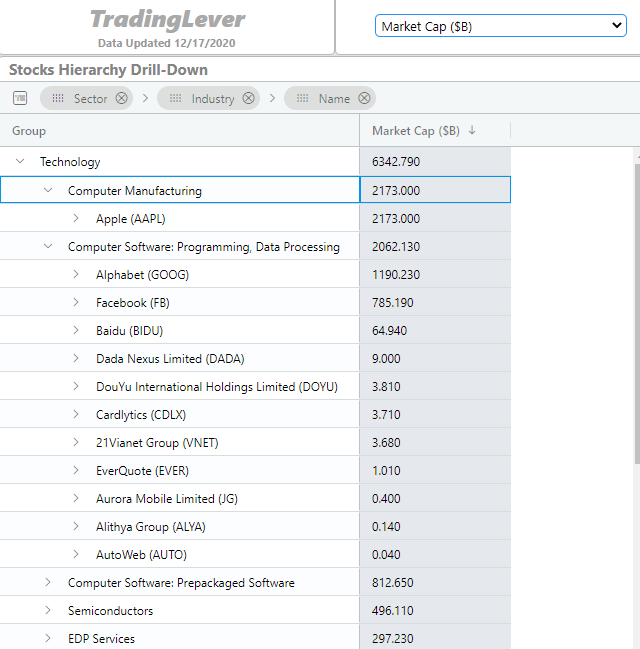
For example, if you want to sort the stocks based on market capitalization, you can simply select market capitalization from the drop-down list at the top, as shown in the screenshot below. The platform will sort the stocks on the basis of market capitalization (from largest to lowest, as selected), while also classifying the list in sectors and industries.
In the screenshot below, we have selected market capitalization from the drop-down list, which means that we want to sort the stocks and sectors on the basis of market capitalization. The software, then, enlists stocks, their sectors, and industries, enabling you to make a better selection. This technique can be useful if an investor wants to invest in only large-cap stocks from different sectors and industries.
As you can see in the screenshot below, the stock analyzer has grouped the stocks in their relevant sectors and industries. The technology stocks are further divided into computer manufacturing, computer software: programming, data processing, semiconductors, EDP services, etc. The technology stocks have the highest market capitalization, with Apple (AAPL) having the highest market capitalization of $2,173 billion.
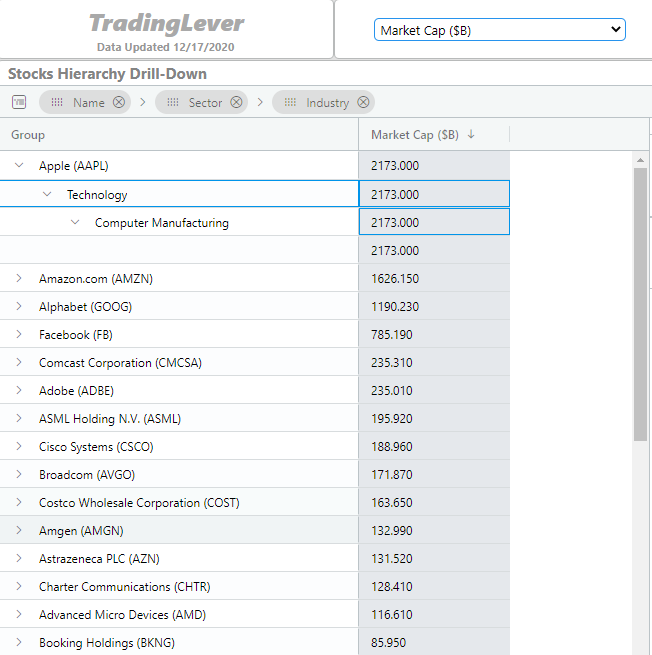
However, if you want to determine what stocks have the most market capitalization instead of the sectors, you can do so by dragging the ‘name’ tag to the start, before the ‘Industry’ and ‘Sector’ tags. This will change the layout of the list and sort the stocks on the basis of market capitalization. In the screenshot below, you can see that instead of grouping the stocks by sector and industry based on market capitalization, the software has now created the list with individual stocks based on the market capitalization. Here’s the list:
In the example above, we have only used the market capitalization metric to analyze stocks. Investors can use different metrics mentioned in the first section of the article for performing stock analysis.
Understanding and Changing the Layout of the Stock Analysis Tool:
The stock analysis tool presents the data in interactive charts, allowing users to visually interpret the data. Users have the option to select the start date, end date, and the period (daily, weekly, monthly, quarterly, yearly). The data is then plotted on the graphs, showing the trend of the metric under study.

At the bottom of the platform (see the screenshot below), users can select further options to expand their analysis. When a user selects any metric from the list in the dropdown menu, a new chart is plotted, comparing the two metrics on the same chart. The metrics available for selection include total revenue, gross profit, net income, operating income, interest income, non-operating income, price close, etc. For example, in the screenshot below, we have chosen to plot an additional chart by selecting ‘Total Revenue’ and ‘Total Operating Expense’ metrics, along with selecting ‘Gross Profit’ in the ‘Show breakdown by’ menu. The resultant chart is then created on the right side of the window. Users can select any of the predefined layouts or can create their custom layouts by dragging the columns in any order.

Conclusions
Many investors and traders use the top-down stock analysis tool for analyzing and selecting stocks to include the right stocks in their portfolios. The tool provides precious information and insights, which can help investors make an informed decision about stock selection. It can help investors save a lot of time as investors can access complete information like closing prices of the stocks to revenues, earnings, profitability ratios, etc, in just a few clicks. The visual illustration of the information in the shape of graphs makes it further easier for investors to interpret the data. Free stock charting software such as Trading Lever aid in hunting for interesting stocks, based on the criteria defined by the investor.