
The Problem:
For many large companies, there are difficulties in managing the cross-company budget and expenses report across all locations.
These difficulties are exacerbated especially for international companies, where multiple currencies are involved. This document is about proposing a useful solution on how to consolidate this data in one useful and easy-to-use Excel file.

For large, multi-site companies, it is not unusual that –
- Each site has its own monthly budget
- Each site can spend the allocated amount and must report to headquarters monthly about the allocated spend – how much was actually spent and on what
- Headquarters must consolidate all expenses from all sites
- Each site may use a different currency, so all reports must be consolidated into one currency, all into one report that shows the breakdown across the sites and the expenses line items
- Each site, even if is not using a different currency, may employ different tax rules. These rules actually behave in a similar way to a different currency, in that we have to transform our data separately for each site, to account for the different tax rules or regulations. This is done using a specific formula for each site.
Many large companies resort to Excel to manage this complicated reporting and consolidation process. Some may have one Excel file for each site, while others may use a shared Excel file for all sites.
It is important to note that these Excel file(s) can be modified by multiple non-financial budget stakeholders, residing at the many sites of the company
Our Solution in Excel
Before we begin, please note that the full Excel examples provided here and in the other articles in our blog can be downloaded from the resources section.
The goal of this article is to propose a simple, easy to use format for one Excel file that will be shared by all sites and allow for an easy fill-in of the line items that are related to expenses or budget within the Excel sheet. It provides a structured way to force (as much as possible) all users to type in the data at the same structure, in a way that makes it easy to aggregate and analyze the data, and prepare a consolidated report from it.
Possible Use Cases
There are several use cases that the format provided here may be useful for:
- Multi-site expenses reporting. This can be useful for –
- Restaurant chains (franchise and non-franchise)
- Retail store chains (franchise and non-franchise)
- Any company that is scattered across multiple sites
- Multi-site budgeting. This can be useful for a collaborative planning process of the budget. Again, it can be used for any geographically scattered company, be it a restaurant chain, retail chain, etc.
- Multi-site currency conversion.
- This applies to all of the above, with the additional possibility of having different currencies for different sites. Here, we will outline a solution that will show how to account of the different currencies, provide automatic currency conversion of all currencies to one currency, and also account for changing exchange rates, in a way that past months will each be calculated using the correct exchange rate that was correct for that month.
How it Works
The solution is based on having one Excel file, shared across the whole organization in multiple sites, and having multiple tabs for different types of Properties.
By having the exact same structure for all Excel sheets, it makes it easy to make cross-sheet calculations such as calculation of properties like Forecast Errors, and other useful formulas.
What is a Property?
A property in our Model is a number with specific units and specific function. Each Property will reside in a different Excel worksheet, all in one Excel file.
Here are some examples of Properties:
- Actual Expense Amount (in dollars, or any other currency)
- Conversion Factor (exchange rate) of converting one unit of the currency of a number into US dollars (for example).
- Actual Income Amount (can also be in dollars, or any other currency)
- Forecasted Expense Amount (any currency)
- Forecasted Income Amount (any currency)
- Properties can also be formulas, such as Forecast Error, defined as the Forecasted Amount minus the Actual Amount.
- For our special uses in this example, we will also defined properties for the Actual Expenses Amount, Actual Income Amout, and the same for forecasts – but all in dollars. For this, we will defined them as calculated properties, and show how to create the formula in a way that it will it will be applied consistently for all line items at all months.
Using the method we describe below, each of these properties will have its own Excel sheet.
By having each cell for each expense/income type reside in the exact same location in each Excel sheet, we will show how it makes it easy to work consistently, refrain from errors, and make it easy to make calculations.
Each property resides in a separate Excel sheet (not file).
Example of a Hierarchy for Expenses Reporting
Here, we will outline a simple hierarchy for an expenses report of a retail chain. These reports are delivered on a monthly basis, and include monthly line items such as –
- Monthly rent expenses
- Salaries
- Bonuses to overachieving employees
- Cleaning costs
- Employee meals
- Special event expenses (if any)
- Store repair costs (if any)
- Car licensing and maintenance
- Other expenses
While this is just an example of such a report, we believe that actual reports will hold similar line items. These line items serve us well enough to explain our concept of how these will be arranged in Excel.
Note that on the right side, we have a list of months for which we are reporting or forecasting expenses. The leftmost columns contain the site name (New York, London, etc.), and as such all the tree is duplicated for each site. This way, we have the complete expense report of all sites in one Excel sheet. The other worksheets in the file are used for currency conversion, error calculation, and more.
For example, we have the tree with the site name on the left.
This is just an example, for a large company with many sites we can have many more line items in the expenses report, as well as many more sites, and so the file becomes much bigger. But still, the structure remains the same, which makes it easy to maintain, use, analyze and understand by management and financial analysts.
Handling multiple currencies
In our solution, we provide an easy way for the handling and conversion of multiple currencies of different sites, all to US dollars. To the end user, we provide this functionality by allowing each site to provide its expenses report in its own currency. This makes it easier to use for site managers and allows them to report in the currency of their choice, while at the same time automatically converting each report to US dollars, for all sites.
We have one Worksheet for managing a property called “Expenses Amount”. This property contains the expenses amount. This is the worksheet shown before. It contains the amount in the local currency of the site.
In addition, we have another worksheet for currency conversion, which contains the Conversion Factor from the local currency of the site to dollars.
As it can be seen, the factor for conversion from dollars (local currency in New York) to dollars is 1, as in no conversion is necessary. However, for converting from EUR to USD the factor is 1.123 and from Canadian Dollars to US Dollars the factor is 0.731.
Formula for Currency Conversion
For simplicity, let’s assume we’re converting from Euro (EUR) to US Dollars (USD). There is a continuous factor of conversion for converting the expenses of a site, given in EUR to the currency of our Headquarters, given in USD. However,the conversion factor is not realized until the company actually converts USD to EUR (to pay the expenses in EUR), or vice-versa. Therefore, it is very difficult to accurately measure the expenses in USD, given that they may not have been paid using the exchange rate of the specific month.
To simplify, we will consider the monthly average conversion rate of the currency, and if needed, to mitigate risks, it is also possible to consider the conversion rate that will provide the highest $ amount in expenses. This will ensure that when we report expenses, we always account for the maximal possible value of these expenses, given the most stringent exchange rate.
In this plot, we show the conversion rate of one EUR to one USD, over the past few years.
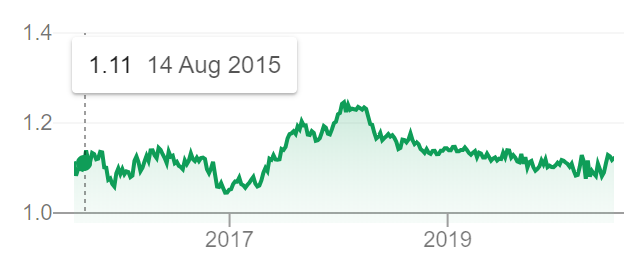
As we see, there is a lot of variability in the exchange rate. This is easily accounted for in the Conversion Factors sheet provided above.
For accurate currency conversion, this data must be brought into our Excel sheet, on a monthly level. We showed above how we prepared the space for it in the worksheet and how it will be used in our currency conversion calculations.
Automating Currency Conversion and Changing Exchange Rates
To automate currency conversion within our Excel file, we will use the currency conversion factors that we prepared in a separate sheet.
For each site using a different currency, there is a separate space (in the same worksheet) that provides the Currency Conversion Factors, as they change over the course of time (in a monthly interval).
We then create a formula to automate the conversion of the local currency to USD, using a new sheet to hold the result in USD. Here is how the formula is defined in Excel. Note the cross-sheet references. Download it from our website to see.
As it can be seen, this formula draws the expenses number for this cell from the expenses sheet, and the conversion factor from the factors sheet, and multiplies them. This is done for each cell in the sheet in a consistent manner, leading to a sheet that contains only US dollar amounts:
Generating a forecast
To create a forecast for the expenses, we create another sheet, similar to the one for the actual expenses:
This sheet works in the same way, as the users can type in their forecast before the actual monthly data is known.
Forecast Errors
By having a worksheet for Actuals and Forecasts, it is now easy to calculate the forecast error.
Note that the forecast error, for our case, is calculated at the local currency, for each site.
If needed, it is possible to also calculate the error in USD by first converting the error into USD using the conversion factors.
This is how the forecast errors sheet looks like:
Filtering Data
Now that we have all data in one Excel file, this makes it much easier to filter and aggregating data in Excel, using PivotTables, PivotCharts or simply clicking on the listbox at the top of each Excel column.
Downloading the Example Excel File
All the examples, formulas, hierarchies, sheets and everything else described in this article can be downloaded for free from the resources section.
Conclusions
This article presented a simple and consistent method to manage expenses in a large company, where there are issues of multi-site and multi-currency reporting. This task is very difficult and error-prone when done in Excel. This document presented a method that should eliminate most human errors in the process by presenting a repeatable process that can easily be further extended to more line items, more locations, and more months/years in the future.